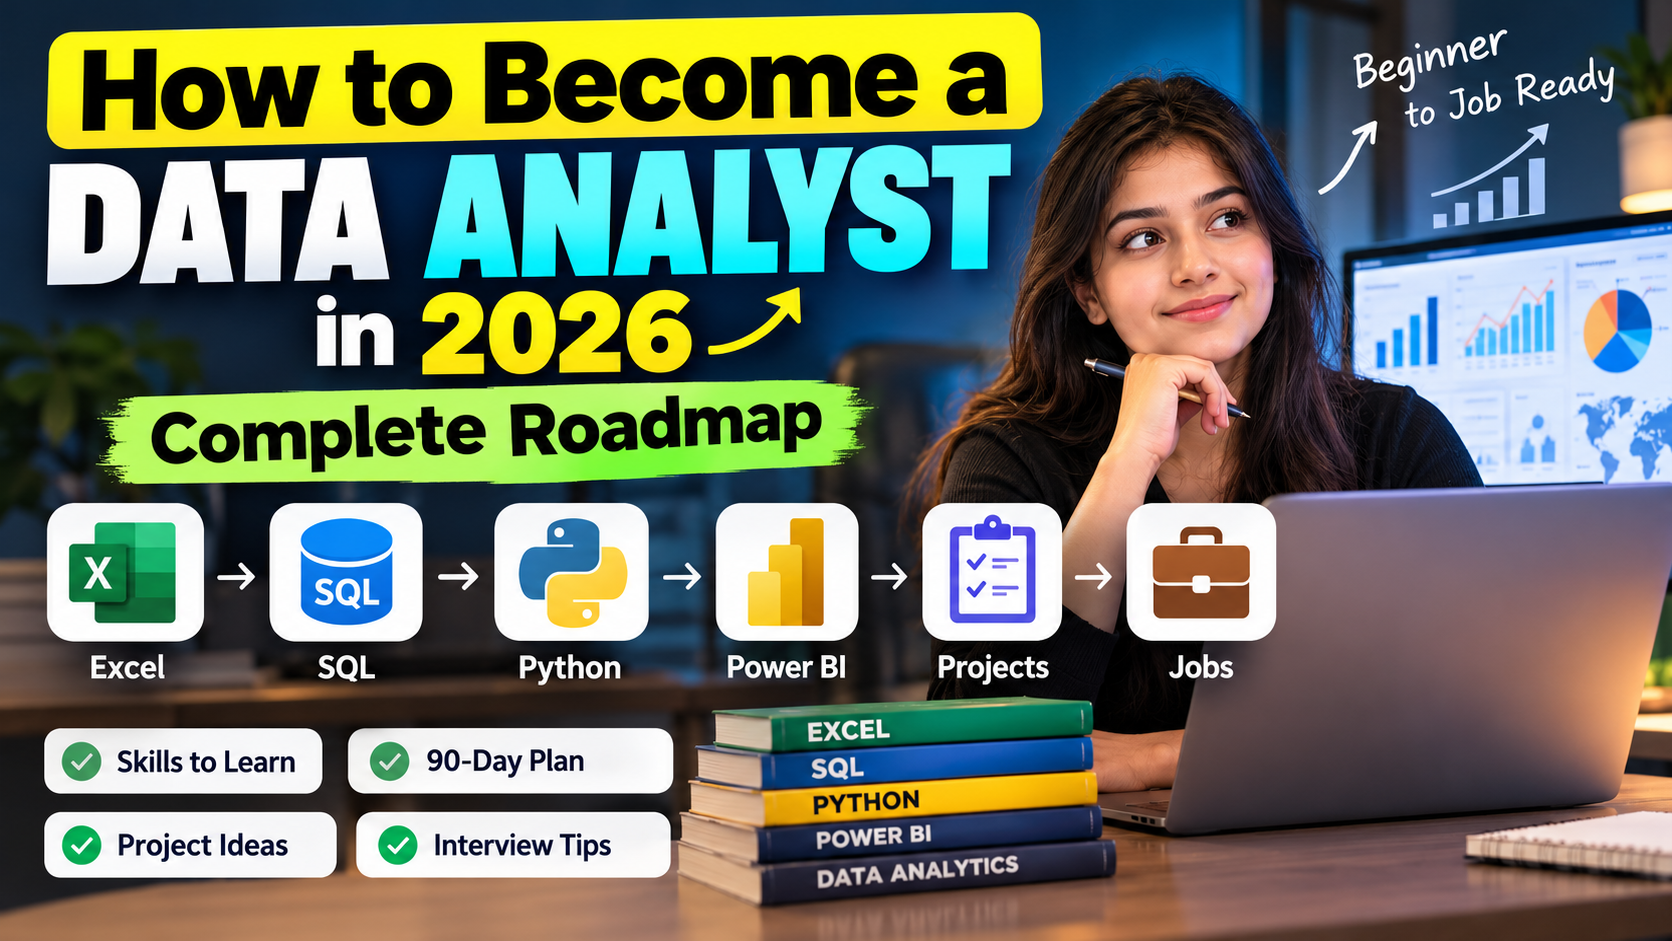
Do you want to become a data analyst but don't know where to start? You may have heard about SQL, Python, Excel, Power BI and statistics, but learning all these skills at once can feel confusing.
The good news is that you do not need to master every tool before you begin working with data. You can build your skills step by step, practise on real datasets, and create projects that demonstrate what you have learned.
This guide explains how to become a data analyst in 2026, which skills to learn first, what projects to build, and how to prepare for entry-level opportunities in India.
Whether you are a college student, a fresher, a working professional or someone considering a career change, this roadmap will help you get started.
Quick overview:
- Understand what a data analyst does.
- Learn Excel and basic statistics.
- Practise SQL to retrieve and analyse data.
- Learn Power BI or Tableau to build dashboards.
- Use Python for data cleaning and analysis.
- Create a portfolio of practical projects.
- Prepare your resume and practise interview questions.
1. What does a data analyst do?
A data analyst collects, cleans, examines and interprets data to help people make better decisions.
Imagine an online store notices that its sales have declined. A data analyst might investigate which products are selling less, whether customer orders have changed, which regions are underperforming, and whether the decline is related to pricing or seasonality.
The analyst then presents the findings through reports, charts or dashboards and explains what the business should investigate next.
Typical data analyst responsibilities include:
- Collecting data from spreadsheets, databases and other sources.
- Cleaning missing, duplicate or incorrectly formatted records.
- Writing SQL queries to retrieve relevant information.
- Analysing trends, performance and business metrics.
- Creating reports and dashboards.
- Explaining findings to non-technical teams.
A data analyst does more than create charts. The goal is to turn data into useful information.
2. What skills do you need to become a data analyst?
You do not need to learn every programming language or analytics platform. Start with the core skills that help you solve practical data problems.
Skill 1: Microsoft Excel
Excel is a useful starting point because it lets you organise, clean, calculate and summarise data.
Learn these topics first:
- Sorting and filtering
- IF, SUMIF, SUMIFS, COUNTIF and COUNTIFS
- XLOOKUP or VLOOKUP
- Text and date functions
- Data cleaning and duplicate removal
- PivotTables and PivotCharts
- Charts and conditional formatting
Practice example: Imagine you have a spreadsheet containing 1,000 sales records. Use Excel to identify the best-selling products, calculate monthly revenue and compare sales across regions.
You should be able to explain what your results mean, not just how you created them.
Skill 2: SQL
SQL stands for Structured Query Language. It allows you to retrieve and analyse data stored in relational databases.
SQL is an important skill for data analysts because business information is often stored in tables rather than ready-to-use spreadsheets.
Learn these topics in order:
- SELECT and FROM
- WHERE and ORDER BY
- DISTINCT and filtering conditions
- Aggregate functions such as SUM, COUNT and AVG
- GROUP BY and HAVING
- INNER JOIN and LEFT JOIN
- Subqueries and common table expressions
- CASE expressions
- Window functions such as ROW_NUMBER and DENSE_RANK
- Handling NULL values and duplicate records
For example, you might want to calculate revenue by product category.
SELECT
    category,
    SUM(sales_amount) AS total_sales
FROM sales
GROUP BY category
ORDER BY total_sales DESC;
This query groups sales records by category, calculates total sales for each category and sorts the results from highest to lowest.
How to practise: Write queries yourself, check the results, and try variations of each question. You can use LogicByte SQL Practice to explore SQL exercises.
Skill 3: Power BI or Tableau
Businesses often need a clear visual summary of their data. Business intelligence tools help analysts create dashboards that communicate trends and performance.
You can start with either Power BI or Tableau. You do not need to master both immediately.
Focus on:
- Importing data
- Cleaning and transforming data
- Creating charts and tables
- Building interactive dashboards
- Using filters and slicers
- Understanding relationships between tables
- Choosing meaningful metrics
- Presenting insights clearly
For example, build a sales dashboard that displays monthly revenue, total orders, top products and regional performance.
A useful dashboard should help someone answer a business question quickly. Avoid adding charts simply to make the dashboard look impressive.
Skill 4: Statistics
You do not need an advanced mathematics degree to start learning data analytics, but you should understand basic statistical concepts.
Start with:
- Mean, median and mode
- Percentages and percentage change
- Range and standard deviation
- Distributions and outliers
- Correlation and causation
- Sampling and basic probability
- Introductory hypothesis testing
For example, average sales may increase because of one unusually large order. The median can sometimes give a better picture of a typical order value.
Statistics helps you avoid misleading conclusions and explain what the data actually supports.
Skill 5: Python
Python is useful when you need to automate repetitive work, analyse larger datasets, or perform more flexible data manipulation.
You do not need to begin with advanced software development or machine learning.
Start with:
- Variables, data types and conditions
- Loops and functions
- Lists and dictionaries
- Reading CSV files
- pandas for data manipulation
- NumPy for numerical operations
- Matplotlib for charts
- Handling missing values and duplicate records
Example using pandas:
import pandas as pd

df = pd.read_csv("sales.csv")

print(df.head())
print(df.isnull().sum())

category_sales = (
    df.groupby("category")["sales_amount"]
      .sum()
      .sort_values(ascending=False)
)

print(category_sales)
This code loads a CSV file, checks for missing values, and calculates sales totals by category.
You can begin practising Python through LogicByte Python Practice.
3. What is the best order to learn data analytics?
A common mistake is trying to learn Excel, SQL, Python and multiple dashboard tools simultaneously.
Instead, follow a sequence that allows each skill to build on the previous one.
StageWhat to learnPractical outcome1Excel and basic statisticsClean and summarise a spreadsheet2SQLQuery and analyse structured data3Power BI or TableauCreate an interactive dashboard4Python and pandasClean and analyse data programmatically5Portfolio and interview practiceDemonstrate your skills with projects
Learn statistics alongside your other subjects rather than waiting until the end.
The best sequence can vary depending on the role you want. Some positions rely heavily on SQL and business intelligence, while others use Python more extensively.
4. A practical 90-day data analyst roadmap
Here is a structured starter plan for beginners. The timeline assumes regular study and hands-on practice; your progress will depend on your previous experience and the time you can dedicate.
Days 1–20: Excel and analytical thinking
Learn spreadsheet formulas, data cleaning, PivotTables and charts.
Practice using a sales dataset. Calculate revenue, identify top-performing products and compare monthly results.
Goal: Complete one spreadsheet analysis and explain three meaningful findings.
Days 21–40: SQL fundamentals
Study SELECT, WHERE, ORDER BY, GROUP BY, aggregate functions and JOINs.
Solve practice problems involving employees, orders, customers and products.
Goal: Write queries independently and explain how each query produces its result.
Days 41–55: Power BI or Tableau
Import a dataset, transform the data, create charts and build an interactive dashboard.
Goal: Complete one dashboard with a clear business purpose and useful metrics.
Days 56–70: Python for data analysis
Learn the Python fundamentals needed to work with CSV files. Practise using pandas to filter, group, clean and summarise datasets.
Goal: Complete a small analysis that produces useful results and visualisations.
Days 71–90: Projects and interview preparation
Finish your portfolio projects, document your methods, practise SQL questions and prepare your resume.
Review the projects as if you were explaining them to an interviewer.
Goal: Have two or three well-documented projects that you can discuss confidently.
This is a starter roadmap, not a guarantee of job readiness in 90 days. If you are studying part-time or starting from scratch, you may need longer.
5. Best data analyst projects for beginners
Projects help you demonstrate that you can apply what you learn. A good project begins with a question, uses relevant data, explains the analysis and presents findings that someone can understand.
Here are five project ideas.
Project 1: Sales performance analysis
Tools: Excel, SQL or Power BI
Questions to investigate:
- Which products generate the most revenue?
- Which months have the highest sales?
- Which regions are underperforming?
- What percentage of sales comes from the top five products?
Deliverable: A sales report or interactive dashboard with written findings.
Project 2: Customer behaviour analysis
Tools: SQL and Python
Investigate purchase frequency, average order value, customer segments and repeat purchases.
Deliverable: A report describing customer patterns and possible areas for further investigation.
Project 3: HR employee analysis
Tools: Excel and Power BI
Explore employee counts, department distribution, tenure, attendance or attrition data where available.
Deliverable: A dashboard that helps a hypothetical HR team understand workforce trends.
Use public or synthetic data and avoid exposing real employees' personal information.
Project 4: E-commerce order analysis
Tools: SQL
Analyse orders, products, revenue, cancellations and customer activity.
Example questions:
- What is the monthly revenue trend?
- Which products are frequently purchased together, if the dataset supports this analysis?
- What is the order cancellation rate?
- Which customers have made repeat purchases?
Deliverable: A collection of SQL queries with explanations and validated results.
Project 5: End-to-end data analytics project
Tools: Excel, SQL, Python and Power BI
Use one dataset throughout the project. Clean the data, investigate the business question, analyse it using SQL or Python, and present the results in a dashboard.
Document:
- The business problem
- The dataset and its limitations
- The cleaning process
- The analysis and methodology
- Key findings
- Recommendations and assumptions
This type of project can help demonstrate how different tools fit together in a practical workflow.
6. How do you build a data analyst portfolio?
A portfolio gives recruiters or hiring managers evidence of how you approach problems.
You can organise your work using GitHub, a personal website, or a portfolio document with links to your projects.
For each project, include:
- Problem statement: What question were you trying to answer?
- Dataset: Where did the data come from, and what are its limitations?
- Tools: Which tools and techniques did you use?
- Process: How did you clean and analyse the data?
- Results: What did you discover?
- Recommendations: What could someone investigate or do next?
- Evidence: Provide code, queries, screenshots or a dashboard where appropriate.
Avoid simply copying a tutorial and presenting it as an original project. If you follow a tutorial, explain what you changed, what you learned and which conclusions are your own.
Two or three thoughtful projects are a useful starting point. More projects are not automatically better if they do not demonstrate different skills.
7. Do you need a degree or certification to become a data analyst?
There is no single educational path for every data analyst role.
Some employers require a particular degree or academic background, while others consider candidates with different qualifications and demonstrable practical skills.
A degree can help meet formal eligibility requirements. Online courses and certifications can provide structure and evidence of learning, but their value depends on the provider, assessment process and relevance to the target role.
Before paying for a certification, check:
- Who issues the credential?
- What knowledge or skills does it assess?
- Is there a meaningful examination or practical assessment?
- Can employers verify the result?
- Does it match the jobs you want to apply for?
Do not assume that completing a course or passing a test guarantees a job. Build practical skills and projects alongside any credential.
8. How should you prepare for data analyst interviews?
Interview preparation should include both conceptual understanding and practical problem-solving.
SQL: Practise joins, aggregation, subqueries, duplicate detection and ranking questions.
Excel: Review formulas, lookups, PivotTables, data cleaning and charts.
Statistics: Understand averages, distributions, correlation and the limitations of your conclusions.
Dashboards: Be ready to explain why you chose particular metrics and visualisations.
Projects: Explain the problem, your approach, your findings and what you would improve.
Communication: Practise presenting an analysis in plain language. Interviewers may care as much about how you reason as about whether you know a particular function.
You can also explore LogicByte's Excel practice and Data Analytics page as part of your practice routine.
9. Common mistakes beginners should avoid
Learning too many tools at once
Build a foundation in Excel and SQL before jumping between several programming languages and dashboard platforms.
Watching tutorials without practising
After learning a concept, use it to solve a new problem without copying the instructor's solution.
Ignoring data quality
Missing values, duplicate records, incorrect data types and inconsistent definitions can produce misleading results.
Building dashboards without a business question
Start with the question your dashboard needs to answer. Choose metrics and visualisations that support that purpose.
Collecting certificates without building projects
Credentials can support your profile, but practical evidence helps demonstrate what you can actually do.
Using AI without checking its work
AI tools can help explain formulas or generate draft SQL queries. However, verify the syntax, test the results, and check whether the output answers the original question.
10. Frequently asked questions about becoming a data analyst
Can I become a data analyst without coding?
You can begin with Excel, spreadsheets and basic analytics without much coding. However, SQL is important for many analyst positions, and Python can expand the kinds of analysis you can perform.
Can a non-technical student become a data analyst?
Yes, it is possible. Students from commerce, economics, science and other backgrounds can learn data analytics. The requirements of individual jobs vary, so check the qualifications and skills employers request.
How long does it take to become a data analyst?
It depends on your starting knowledge, study time, learning resources and project experience. A 90-day plan can establish a foundation, but becoming competitive for jobs may take several additional months of consistent practice.
Which skill should I learn first: Excel, SQL or Python?
Excel is a useful starting point for working with tabular data. SQL is essential for retrieving information from relational databases. Python is valuable for programmatic analysis and automation. You can begin with Excel and SQL, then add Python as your needs grow.
Is Python compulsory for every data analyst job?
No. Requirements vary by company and role. Some positions emphasise SQL, Excel and business intelligence tools, while others expect Python or another programming language.
Which projects are best for a fresher's resume?
Sales analysis, customer behaviour analysis, HR analytics and e-commerce analysis are useful starting points. Choose projects that let you explain the problem, demonstrate your methods and communicate meaningful findings.
Should I learn Power BI or Tableau?
Start with one tool and become comfortable importing data, building relationships, creating visualisations and communicating insights. You can learn the other later if your target roles require it.
Conclusion: Start building your data analyst skills today
Becoming a data analyst is a process of building skills, applying them to real problems and learning how to explain your findings.
Start with Excel and basic statistics, learn SQL, build dashboards using a BI tool, and then expand your capabilities with Python. Create practical projects throughout the process rather than waiting until you have finished every course.
You do not need to learn everything at once. Consistent practice and a portfolio of well-explained work can help you understand your strengths and identify what to improve next.
Ready to practise your skills?
Explore LogicByte SQL Practice, Python Practice, Excel Practice and Data Analytics to continue developing your practical skills.
LogicByte — practical learning and skill assessment resources for students and aspiring professionals.